In Perspective: The Northern Colorado Housing Market
Market Update

Market Update
The real estate market throughout Northern Colorado remains robust and dynamic, as we come into the new year, 2026. We anticipate a year filled with potential and we’re pleased to present updates that highlight the current market conditions. We’ll take a look at the past 12 months in this issue of In Perspective and also look at what we might expect this year. Let us examine the market's activity in detail. Take a moment with us to review the current trends as we move forward into 2026.
Sales Prices are Flat to Slightly Up: The year ended with most markets experiencing a slight increase in the average sales price year over year. For instance, Timnath experienced a 6% sales price increase year over year, driven by low inventories of luxury homes which comprise an oversized portion of the Timnath Market. Longmont was up 1%, Berthoud up 3%. Fort Collins and Boulder were Flat. The only market to loose value was Estes Park with a 3% drop, driven by lower buyer demand and a higher than normal availability of homes for sale.
Number of Sold Listings Up YoY: Looking at the full year of data, despite lower buyer demand across the 2025 calendar year, most markets experienced modestly higher sales levels than 2024 driven by sellers providing incentives to buy and more choices available to buyers. Windsor and Estes Park were up 5%, Fort Collins and Loveland up 3%, Boulder up 2%. Denver Metro was down 4% driven by lower buyer demand and Timnath down 13% driven by lower inventory levels.
Inventory Levels Up YoY: Entering the new year, we’re seeing most markets experiencing more homes available than this time last year, giving more options for buyers at a time that seasonally typically has low inventory levels. Boulder has 20% more homes on the market than this time last year. Loveland is up 14% and Estes Park up 6%. Berthoud, however, is down 9% and Fort Collins down 1%.
Luxury Homes (top 5% of the market) Values Up, Inventory Down: If you have been following the luxury market along with us in 2025, it’s no surprise to you that values are up across the region: Estes Park’s average luxury sales price is up 11% YoY to $2,250,000; Fort Collins is up 2% and Longmont up 11%. With the context that inventory levels of luxury homes are down, it’s no wonder that prices have increased in the past 12 months. Fort Collins inventory levels for luxury homes are down 29% YoY, Berthoud down 12%, and Windsor down 25%.
What to Expect in 2026: With mortgage interest rates mostly stable now for a quarter and experiencing subtle downward movement, Fed interest rates seemingly coming down, we are watching the buyer market this month to watch for signs for demand which will guide the rest of the year. If your watching headlines, be on the lookout this month for phrases like “mortgage applications are up” or “the number of pending home sales is up over this time last year…”. Both of these will be indicators that the market will be experiencing a robust spring. For buyers, we recommend getting in the game early this year to avoid potential competitive situations if buyer demand is high and inventory levels get absorbed quickly. For sellers, we recommend closely watching inventory levels in your neighborhood and market as timing of entering the market will be highly important this year. A delay of a week could shift the market dramatically. In either case, contact us as soon as possible so we can add you to our list of clients we’re keeping actively informed as the year progresses.
Kelly McBartlett Founder and Principal Agent
Nationally, the U.S. housing market closed 2025 with nominal prices largely intact but transaction volumes materially suppressed. This apparent stability is not demand-driven. It is the result of mortgage-rate lock-in, strong homeowner balance sheets, and limited forced selling—conditions that have kept price indices stable even as liquidity thins.
Northern Colorado reflects this regime almost precisely. In December 2025, prices held flat while sales volumes declined and inventory rose, a configuration identical to national housing patterns.
For example, across major Northern Colorado regions:
Average single-family prices ranged from -1% to +1% year over year.
Closed sales declined by 2–4% in Larimer County, Boulder Valley, and Denver Metro.
Homes for sale increased by 2% in Denver Metro, 7% in Northern Colorado, and 19% in the Denver Foothills.
This is not a market failing to price correctly—it is a market choosing not to clear.
At the regional level, December 2025 data show inventory rebuilding at a faster pace than demand, while pricing remains anchored.
Northern Colorado recorded a 7% increase in active listings, while closed sales rose just 4%, pushing months of inventory to 2.6 months.
Denver Metro inventory rose 2%, while closed sales declined 4%, with months of inventory increasing to 2.1 months.
Boulder Valley inventory increased 5%, sales fell 4%, and months of inventory held at 2.4 months.
Despite this divergence between supply and demand, pricing remained remarkably stable:
Northern Colorado average single-family price: +1% YoY
Denver Metro: +1% YoY
Boulder Valley: 0% YoY
These numbers confirm that sellers are absorbing softer demand through longer marketing times, not price reductions.
At the city level, the same dynamics appear with sharper contrast.
Sales volumes declined materially in several markets:
Timnath: -47% YoY
Windsor: -22% YoY
Estes Park: -19% YoY
Fort Collins: -10% YoY
Inventory conditions diverged:
Boulder active listings: +20% YoY, months of inventory 3.0
Estes Park listings: +6% YoY, months of inventory 4.8
Longmont listings: +1% YoY, months of inventory 2.2
Fort Collins listings: -1% YoY, months of inventory 1.7
Pricing followed these fundamentals:
Timnath average price: +3% YoY, supported by luxury-weighted inventory
Berthoud: +5% YoY
Longmont: +1% YoY
Fort Collins and Boulder: -1% YoY
Estes Park: -3% YoY, the only notable decline
Each city’s outcome is internally consistent when sales, inventory, and months of supply are viewed together.
Buyers
Inventory growth of 5–20% across many cities has improved selection without reducing prices. Negotiating leverage is strongest in markets where months of inventory exceed three months, such as Estes Park and Boulder.
Sellers
Flat pricing combined with rising inventory means timing matters more than price optimism. In Denver Foothills, for example, inventory rose 19% while prices declined 1%, increasing competition without forcing widespread discounts.
Investors
Flat prices paired with declining sales volumes (often -10% to -25% at the city level) elevate exit liquidity risk. Holding periods must lengthen to compensate.
Relocation Clients
Markets such as Northern Colorado overall—where inventory is up 7% and prices are up just 1%—offer functional entry points with improving choice and limited price risk.
National luxury housing markets have become thin, episodic, and composition-driven. Pricing metrics increasingly reflect individual transactions rather than continuous demand.
Northern Colorado’s luxury data reflect this reality precisely.
Luxury closed sales declined sharply:
Northern Colorado: -31% YoY
Larimer County: -34% YoY
Weld County: -23% YoY
Luxury months of supply remained elevated:
Northern Colorado: 4.5 months
Denver Metro: 4.2 months
Boulder Valley: 11.5 months
Despite this, average luxury prices increased:
Northern Colorado: +3% YoY
Denver Metro: +5% YoY
Boulder Valley: +106% YoY, driven by a single $8.25M transaction
Meanwhile, total luxury dollar volume declined:
Northern Colorado: -27% YoY
Larimer County: -29% YoY
Weld County: -23% YoY
Rising prices alongside falling dollar volume confirm that luxury pricing strength is statistical, not systemic.
At the city level, volatility intensifies:
Boulder luxury months of supply: 10.4 months
Estes Park: 7.7 months
Berthoud: 5.6 months
Luxury inventory declined sharply in several cities:
Fort Collins: -29% YoY
Windsor: -25% YoY
Berthoud: -13% YoY
Pricing swings were extreme:
Estes Park luxury average price: +45% YoY
Longmont: +28% YoY
Fort Collins: +2% YoY
Timnath: -16% YoY
These figures reflect transaction scarcity, not broad appreciation.
Luxury Buyers
Elevated supply (4–11 months) improves choice, but averages are unreliable. Transaction-level analysis is essential.
Luxury Sellers
Liquidity is intermittent. In markets where sales declined 30–60%, correct initial pricing determines whether a sale occurs at all.
Investment-Oriented Clients
Luxury housing currently behaves as a capital preservation asset. With volumes down 20–30%, exit timing—not price—is the dominant risk.
Legacy Clients
Luxury assets retain value but lack immediacy. Planning horizons must reflect multi-year liquidity windows.
Luxury Relocation Clients
Patience and flexibility are rewarded. Markets clear episodically, not continuously.
Northern Colorado is not diverging from national housing trends—it is expressing them cleanly.
Prices are stable because markets are thin.
Inventory is rising, but not fast enough to force repricing.
The general market is normalizing slowly.
The luxury market is illiquid and composition-driven.
For economists and sophisticated participants, the conclusion is unambiguous:
In this housing cycle, liquidity—not price—is the primary signal.
Stay up to date on the latest real estate trends.

Northern Colorado
Northern Colorado & Denver Metro Area Market Report


Northern Colorado
Northern Colorado & Denver Metro Area Market Report

Home By Design
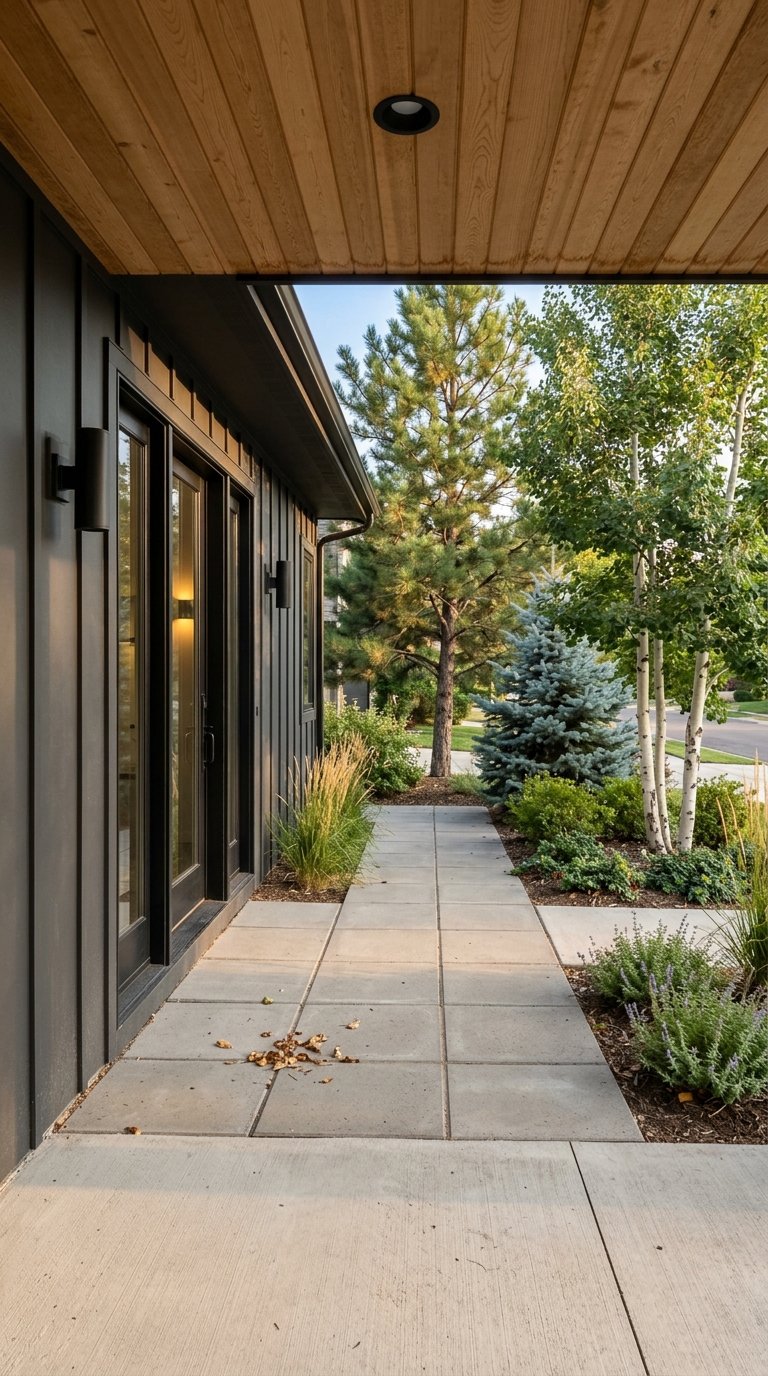
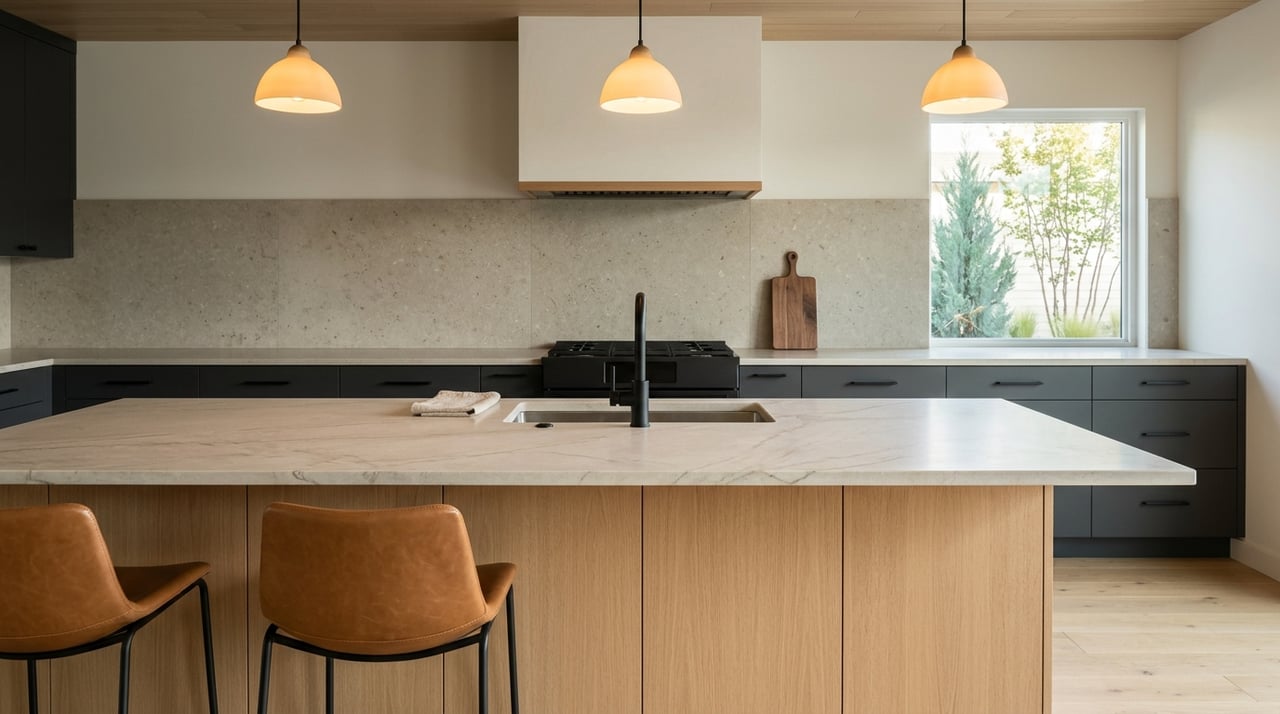
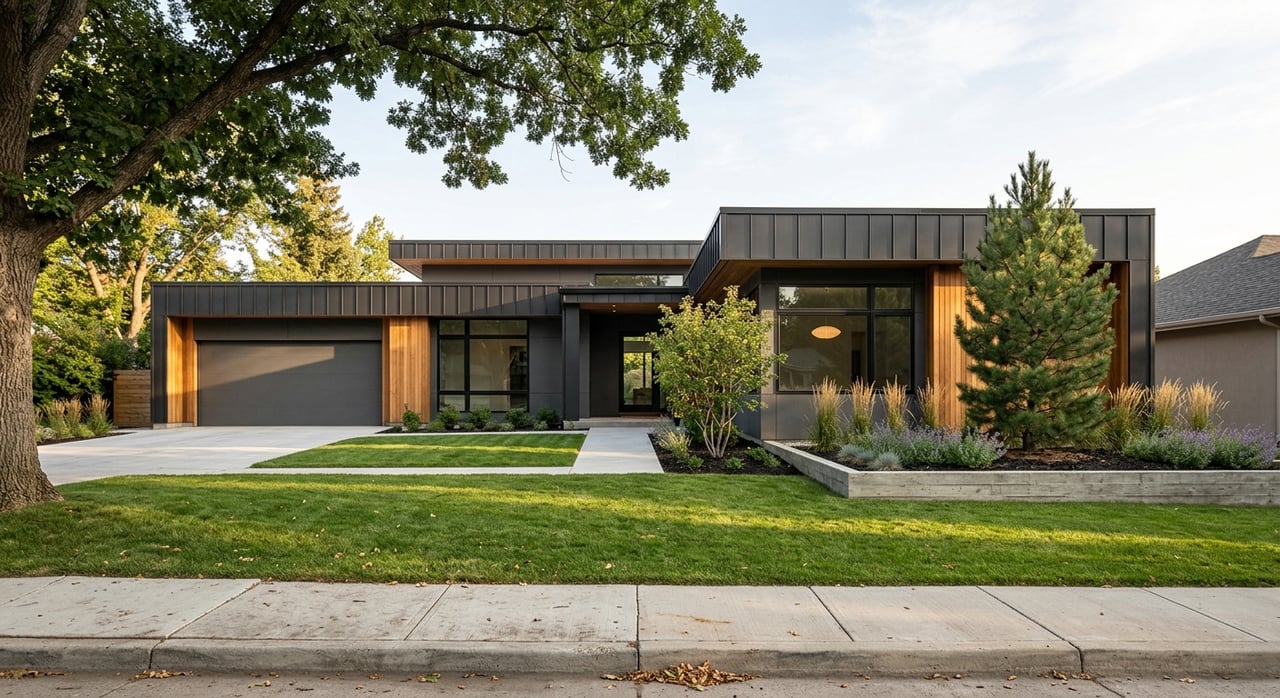
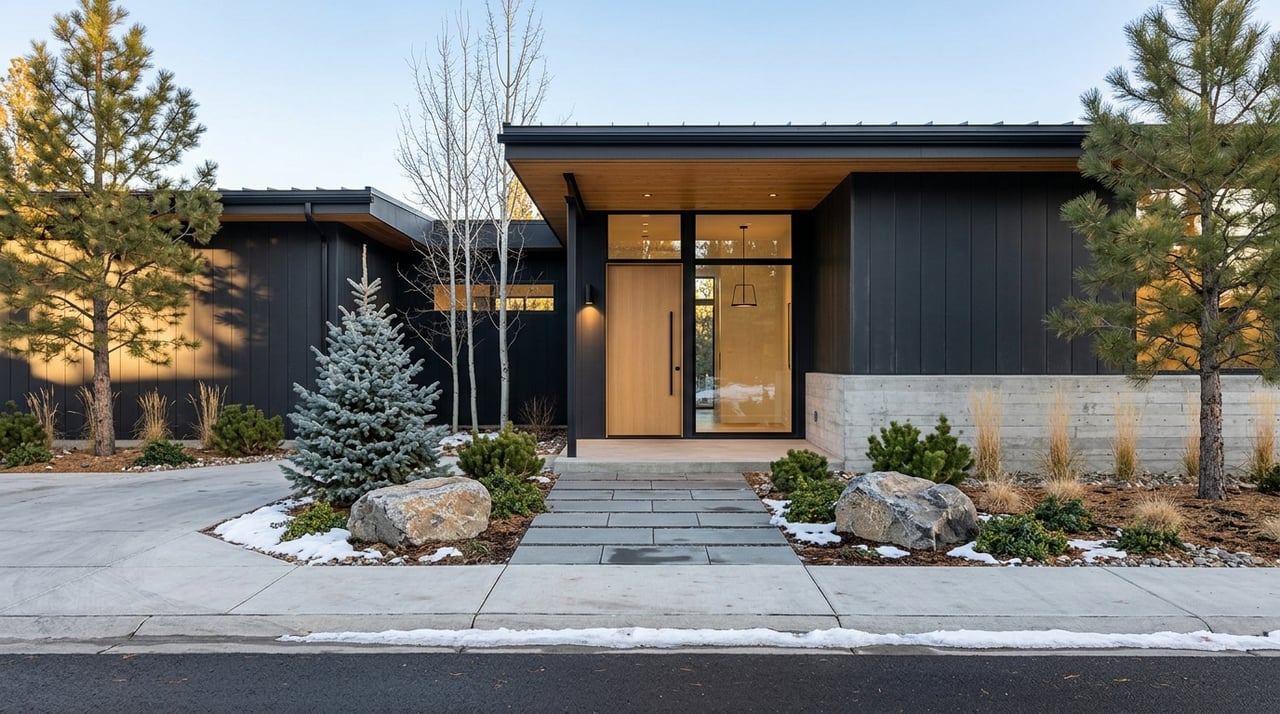
REWORKING A 1915 HOME IN CLASSIC—YET WARM—STYLE
We enjoy being able to provide the level of expert detail and understanding to our clients that we would expect as a client if we were working through the same process. Whether it be going through the home buying process or listing your home, we look forward to working with you soon!
Ready to start a conversation?

Fort Collins 242 Linden St, Suite 216, Fort Collins, CO 80524 Boulder 1470 Walnut St, Suite 201/202, Boulder, CO 80302 Denver 200 Columbine St, Suite 400, Denver, CO 80206