Northern Colorado July 2026 Market Report | In Perspective
Market Update

Market Update
REAL ESTATE IN PERSPECTIVE July 2026 Market Report | Northern Colorado, Boulder Valley, Denver Metro & Denver Foothills
EXECUTIVE SUMMARY
July's numbers are in, and the story this month is momentum in the north. While the Denver Metro saw closed sales ease about 4% from last July, Northern Colorado moved the other direction — up 3% year-over-year, led by some of the strongest city-level gains we've seen all year. Here's what the data says, and what it means for you.
Northern Colorado outpaces the metro. Larimer County closed 609 sales in July, up 13% from 537 a year ago, while inventory held nearly flat at 2,100 homes. Loveland was the standout: 159 closings, up 31% year-over-year, with months of inventory tightening from 4.1 to 3.3. Fort Collins added a 10% gain of its own at 267 sales. When sales rise and supply doesn't, pricing power follows — worth watching as we head into late summer.
Timnath's turnaround. A year ago, Timnath carried 131 active listings and five-plus months of supply. This July: 101 actives, 34 closings (up 42%), and 4.3 months of inventory. The high end drove it — five sales over $1,150,000 versus just one last July, pushing Timnath's total sales volume up more than 600%.
A record month for the upper end. The $2,400,000+ market in Denver nearly tripled, with 36 closings versus 13 last July and $114.5 million in volume. Douglas County's high-end sales more than doubled. Closer to home, Larimer County logged 57 sales at $1,150,000 or more — up 43% — totaling $90.7 million, with July's top sale at $3,990,000 right here in Fort Collins. Boulder's $4,000,000+ segment posted seven closings against three a year ago, topping out at $8,500,000. Buyers at the top of the market are decisively back.
Single-family holds, attached softens. The divergence between property types continued in July. Rolling 12-month single-family prices were essentially steady — Fort Collins up 4% to $739,325, Windsor up 4% to $724,970 — while attached and condo pricing slipped almost everywhere: down 4% in Berthoud, 5% in Weld County, and 5% in Boulder. If you own a townhome or condo, pricing strategy matters more right now than at any point in the last two years.
Where the opportunities are. Berthoud's inventory climbed 23% year-over-year and months of supply moved from 4.8 to 6.4 — the most buyer-friendly conditions among our nine tracked cities. Estes Park remains a patient market at 7.4 months of supply. For sellers in Fort Collins, Loveland, and Longmont, sub-3.5-month supply keeps you firmly in the driver's seat with a well-priced, well-presented home.
What it means for you. If you're selling in Northern Colorado, demand is real and rising — but buyers are selective, and the attached-home data proves they'll discount anything that isn't dialed in. If you're buying, segments like Berthoud and the condo market offer genuine negotiating room, and the luxury tier is competitive again, so preparation wins. Utilizing all of our proprietary buyer and seller technology, strategy and marketing systems, we're on your side to create success. Feel welcome to contact us to discuss your situation.
— Kelly McBartlett, Principal Agent & Founder
RATES CLIMBED EVERY WEEK IN JULY
The Federal Reserve left its benchmark alone on July 29, holding at 3.50 to 3.75 percent for a fifth straight meeting. The vote was the interesting part. Nine to three, with all three dissenters pushing for a quarter-point increase. HousingWire's read was that the hawks got most of what they wanted regardless, since both nominal and real yields rose on the announcement. Chair Kevin Warsh has stripped forward guidance out of the Committee's statements, which leaves markets to interpret the data themselves between meetings. September 16 brings the next decision.
The ten-year Treasury did the more consequential work. It drives mortgage pricing far more directly than the federal funds rate does, and it pushed past 4.7 percent in the last full week of July, its highest level since January 2025. Iran-related supply pressure had carried crude toward $100 a barrel. National Mortgage News raised the prospect of mortgage rates crossing back above 7 percent. Freddie Mac's weekly survey followed the yield up: 6.49 percent, then 6.55, then 6.58, then 6.66 by July 30, the highest weekly reading in roughly a year, and 6.69 by August 6.
In February the 30-year averaged 5.98 percent. That comparison tells you more about the year than any single week can.
Nationally, existing homes are selling at roughly a 4.09 million annual pace, the median price sits at a record $440,600, and inventory stands near 1.56 million units, or 4.6 months of supply. New construction is running on entirely different terms. Sales there are near a 628,000 annual pace, down 5.6 percent from a year ago, with a median price of $398,300 and 9.3 months of supply. Builders hold roughly twice the standing inventory of the resale market and are buying down rates to clear it. That has direct consequences in Weld County and Timnath, where new construction makes up a large share of what trades.
Two forces will shape the rest of the year.
Supply is still hostage to the mortgages people already hold. About 70 percent of American homeowners carry a rate at or below 5 percent, which strangles the ordinary churn of moving up and moving down. Whatever does reach the market gets tested hard: more than 40 percent of listings nationally have taken a price cut. HousingWire has spent the year arguing that the number worth watching is how efficiently a market converts inventory into transactions. Northern Colorado rewards that lens.
The second force sits at the top of the market, which has pulled steadily away from everything beneath it. Coldwell Banker's mid-year luxury report found 63 percent of its luxury specialists seeing more all-cash purchases among clients, up from 51 percent a year earlier. In May, the top 5 percent of transactions accounted for roughly 65.6 percent of all single-family dollar volume in the country. Buyers paying cash scarcely notice a move in the ten-year, which explains most of the separation.
Condominiums, meanwhile, are having a harder year than the price headlines alone suggest. Median association dues have climbed roughly 29 percent since 2019, to about $420 a month. Insurance repricing, reserve-funding requirements imposed after the 2021 Surfside collapse, and tightened agency financing rules in 2026 have all raised the true monthly cost of ownership even where purchase prices have fallen. A May survey found 54 percent of condominium communities raising regular assessments, and 14 percent levying special ones. Buyer appetite is intact. The carrying cost is what changed.
All three patterns show up plainly in the Northern Colorado numbers.
NORTHERN COLORADO AND SURROUNDING REGIONS | ALL PRICE POINTS
Northern Colorado | Boulder Valley | Denver Metro | Denver Foothills | |
|---|---|---|---|---|
Homes for Sale, Jul 2026 | 3,851 | 1,464 | 10,193 | 2,293 |
Homes for Sale, Jul 2025 | 3,732 | 1,569 | 10,343 | 2,292 |
YoY Change | +3% | -7% | -1% | 0% |
Sold Listings, Jul 2026 | 1,051 | 400 | 2,789 | 719 |
Sold Listings, Jul 2025 | 1,016 | 382 | 2,917 | 780 |
YoY Change | +3% | +5% | -4% | -8% |
Months of Inventory, Jul 2026 | 3.95 | 4.1 | 3.7 | 3.4 |
Months of Inventory, Jul 2025 | 3.9 | 4.4 | 3.76 | 3.4 |
YoY Change | +1% | -7% | -2% | 0% |
Avg Sales Price, Single Family 2026 | $632,819 | $1,084,324 | $788,027 | $820,763 |
Avg Sales Price, Single Family 2025 | $637,159 | $1,079,683 | $782,111 | $825,926 |
YoY Change | -1% | 0% | +1% | -1% |
Avg Sales Price, Attached 2026 | $398,851 | $544,880 | $466,047 | $437,456 |
Avg Sales Price, Attached 2025 | $409,311 | $567,921 | $473,527 | $454,033 |
YoY Change | -3% | -4% | -2% | -4% |
Average sales prices reflect a rolling 12-month average.
COUNTY DETAIL | NORTHERN COLORADO
Larimer | Weld | |
|---|---|---|
Homes for Sale, Jul 2026 | 2,100 | 1,751 |
YoY Change | +1% | +6% |
Sold Listings, Jul 2026 | 609 | 442 |
YoY Change | +13% | -8% |
Months of Inventory | 4.2 | 3.7 |
YoY Change | -2% | +6% |
Avg Sales Price, Single Family | $696,954 | $568,683 |
YoY Change | 0% | -1% |
Avg Sales Price, Attached | $433,969 | $363,733 |
YoY Change | -1% | -5% |
MORE SALES, FLAT PRICES
Northern Colorado sold more houses in July than it did a year ago and charged no more for them. Most of what follows in the regional data comes out of that one sentence.
The region is tighter than the country, at 3.95 months of inventory against a national 4.6, and on velocity it is running at or slightly above the national pace. Pricing is another matter. The national median sits at a record while Northern Colorado's average single-family price slipped a percent. In a year when more than four in ten listings nationally have taken a cut, a market that moves more volume at steady prices is doing what a healthy market does. Sellers anchored to a 2022 comparison will experience it as weakness anyway, which is worth knowing before the listing conversation starts.
One caution about those price figures. They are rolling 12-month averages, so they smooth and they lag. A flat rolling average can conceal several months of recent softening just as easily as recent firming, and a one-percent move in one proves very little by itself. We read it alongside the inventory and absorption figures, which carry the fresher signal.
The county split is where this month gets interesting. Larimer added inventory modestly, up 1 percent, and absorbed it faster: 13 percent more closings, months of inventory improving from 4.3 to 4.2. Weld added inventory faster, up 6 percent, and absorbed less of it, closing 8 percent fewer sales while months of inventory rose from 3.5 to 3.7. Weld remains the tighter of the two in absolute terms, though the lines crossed this month. Builders nationally are carrying 9.3 months of supply and buying down rates to clear it, which makes Weld's construction pipeline a plausible culprit on the supply side. Whether this holds through autumn or turns out to be a one-month artifact is the question we will be watching.
MAIN CITIES | ALL PRICE POINTS
Market | Homes for Sale | YoY | Sold | YoY | Months Inv. | YoY | Avg SF Price | YoY |
|---|---|---|---|---|---|---|---|---|
Fort Collins | 724 | +4% | 267 | +10% | 3.4 | 0% | $739,325 | +4% |
Berthoud | 202 | +23% | 27 | -16% | 6.4 | +33% | $784,444 | +3% |
Estes Park | 188 | +2% | 26 | -4% | 7.4 | -5% | $905,284 | +4% |
Loveland | 432 | -6% | 159 | +31% | 3.3 | -20% | $627,248 | -1% |
Timnath | 101 | -23% | 34 | +42% | 4.3 | -14% | $880,777 | -5% |
Windsor | 307 | -1% | 78 | -13% | 4.0 | +8% | $724,970 | +4% |
Boulder | 666 | -3% | 133 | -9% | 5.5 | -2% | $1,615,933 | -3% |
Longmont | 411 | +1% | 145 | +28% | 3.4 | 0% | $727,389 | -1% |
Denver Metro | 10,193 | -1% | 2,789 | -4% | 3.7 | -2% | $788,027 | +1% |
Evergreen | 252 | +15% | 56 | +8% | 5.9 | +9% | $1,158,645 | -8% |
ATTACHED / CONDO AVERAGE SALES PRICE
Market | Jul 2026 | Jul 2025 | YoY |
|---|---|---|---|
Fort Collins | $408,877 | $412,024 | -1% |
Berthoud | $456,902 | $475,695 | -4% |
Estes Park | $559,519 | $551,710 | +1% |
Loveland | $412,033 | $422,913 | -3% |
Timnath | $602,329 | $505,048 | +19% |
Windsor | $428,292 | $452,474 | -5% |
Boulder | $601,499 | $631,083 | -5% |
Longmont | $443,227 | $458,958 | -3% |
Denver Metro | $466,047 | $473,527 | -2% |
Evergreen | $642,490 | $698,054 | -8% |
NINE MARKETS UNDER ONE AVERAGE
Regional averages are a courtesy. They tell you what a region did on the whole and almost nothing about what any given town did, and this month the spread runs close to two to one. Loveland clears its inventory in 3.3 months. Berthoud needs 6.4. Estes Park needs 7.4.
Loveland gave us the month's clearest absorption story: sales up 31 percent, inventory down 6 percent, months of inventory falling from 4.1 to 3.3, the largest improvement anywhere in the region. That volume came without price support, with single-family off a percent and attached off three. At $627,248, Loveland carries the lowest average single-family price of any Northern Colorado city we track, and velocity at that price point suggests buyers are finding value. Anyone priced out of Fort Collins should study this pattern.
Fort Collins held the anchor position. Sales rose 10 percent, inventory rose 4 percent, months of inventory stayed at 3.4, and average single-family pricing gained 4 percent to reach $739,325, the best price performance among the region's larger markets. A market absorbing more volume at a higher average price while adding supply is showing real depth. The employment base, the university, and the land constrained inside the growth management area all continue to support it.
Berthoud changed most. Inventory rose 23 percent, sales fell 16 percent, and months of inventory went from 4.8 to 6.4, a 33 percent deterioration and the region's steepest. Average single-family pricing still shows a 3 percent gain, though that is a rolling figure and would not be expected to hold indefinitely against absorption at this level. Berthoud's development pipeline is large relative to the town, and this is the submarket we will follow most closely over the next two quarters. Sellers there might reasonably weight recent comparable sales well above year-ago averages.
Timnath posted a 23 percent inventory decline and a 42 percent sales gain, on 34 closings against 24, in a market where new construction dominates. Delivery schedules and incentive structures move averages there independently of demand. Single-family pricing down 5 percent alongside attached up 19 percent reads most plausibly as a mix effect. Treat Timnath's monthly percentages with more caution than most.
Windsor ran the reverse of Loveland, with prices firm at 4 percent higher and velocity fading: sales off 13 percent, months of inventory rising from 3.7 to 4.0. Estes Park continues to behave as a resort and second-home market rather than a primary-residence one, carrying the region's longest absorption at 7.4 months. That is a structural feature of seasonal markets, though carrying costs and insurance availability increasingly belong in the underwriting there.
Evergreen recorded the weakest pricing of anything we track: single-family down 8 percent, attached down 8 percent, inventory up 15 percent. Mountain and foothills markets across Colorado are absorbing insurance repricing and wildfire underwriting in ways the Front Range largely is not. Buyers looking at foothills property would do well to get quotes early in diligence rather than late.
Boulder softened at both ends, with sales down 9 percent, single-family down 3 percent, and attached down 5 percent.
The attached and condominium column carries the most consistent signal anywhere in this dataset. Values fell in eight of ten cities and in all four regions: Northern Colorado down 3 percent, Boulder Valley 4, Denver Metro 2, Denver Foothills 4. Only Estes Park posted a meaningful gain, at 1 percent, and Timnath's 19 percent reads as new-product mix.
This is a national condition expressing itself locally. Dues, insurance, reserves, and financing rules are doing the work, and buyer appetite has held up. Denver's urban condominium market has been the sharpest local version of it, with independent analysis putting values roughly 14 percent below their 2022 peak while suburban attached product has held rather better.
THE COST OF HOLDING IS RISING FASTER THAN THE COST OF BUYING
This runs underneath every number in the report and deserves to be stated plainly. Prices in Northern Colorado were roughly flat this year. The cost of owning was not.
Property taxes account for the largest share of the change. The temporary relief Colorado enacted in 2023 and 2024 is expiring, and the permanent assessment rates underneath it are phasing in. For 2026, residential property is assessed at 7.05 percent for school districts and 6.25 percent for local government districts, with a 10 percent value exclusion capped at $70,000 applied to the local government portion. The practical result across the state has been bills rising 20 to 40 percent, and in a number of cases on properties whose assessed value did not increase at all. Colorado reassesses on a two-year cycle and bills a year in arrears, so the increases arriving now reflect an earlier valuation period rather than today's market.
Insurance is the second pressure, particularly along the foothills, where wildfire underwriting has tightened materially. Association dues are the third, for anyone in attached product.
Taken together, these three items can move a monthly payment without a single basis point of change in the mortgage rate. A buyer who qualified on principal, interest, taxes, and insurance last spring may find the escrow analysis twelve months later tells a different story. An owner holding a rental sees it as compressed net yield. And for anyone holding property inherited or owned for decades, property tax is the line item most likely to have changed substantially since the last time they looked closely.
Two practical notes. Notices of valuation go out by May 1 with protests due June 1, so this year's appeal window has closed and the next arrives in 2027. Homeowners aged 65 and older who have owned and occupied a property for at least ten years may qualify for the Senior Property Tax Homestead Exemption, which exempts half the value of the first $200,000. Both are worth a calendar entry.
LUXURY MARKET | REGIONS
Northern Colorado | Boulder Valley | Denver Metro | Denver Foothills | |
|---|---|---|---|---|
Threshold | $1,150,000 | $4,000,000 | $2,400,000 | $2,400,000 |
New Listings, Jul 2026 | 119 | 14 | 81 | 14 |
YoY Change | +1% | +100% | +5% | -26% |
Homes for Sale, Jul 2026 | 427 | 92 | 322 | 92 |
YoY Change | -2% | +11% | -5% | +3% |
Closed Sales, Jul 2026 | 64 | 7 | 69 | 4 |
YoY Change | +19% | +133% | +92% | -20% |
Months of Supply, Jul 2026 | 7.8 | 23.5 | 6.0 | 11.4 |
Months of Supply, Jul 2025 | 7.6 | 18.1 | 7.5 | 12.7 |
YoY Change | +3% | +30% | -20% | -10% |
Avg Sales Price, Jul 2026 | $1,567,361 | $6,364,643 | $3,495,548 | $2,967,500 |
YoY Change | +5% | +26% | -2% | -8% |
Total Sales Volume, Jul 2026 | $101,537,653 | $44,552,500 | $233,014,932 | $11,870,000 |
Total Sales Volume, Jul 2025 | $82,298,220 | $15,150,000 | $122,832,601 | $16,175,000 |
YoY Change | +23% | +194% | +90% | -27% |
Highest Sale, Jul 2026 | $2,805,000 | $8,500,000 | $7,112,500 | $3,800,000 |
Highest Sale, Jul 2025 | $3,800,000 | $5,900,000 | $7,750,000 | $4,500,000 |
COUNTY DETAIL | NORTHERN COLORADO LUXURY ($1,150,000+)
Larimer | Weld | |
|---|---|---|
New Listings | 80 (+1%) | 39 (0%) |
Homes for Sale | 283 (-9%) | 144 (+16%) |
Closed Sales | 57 (+43%) | 7 (-50%) |
Months of Supply | 6.6 (-14%) | 9.0 (+22%) |
Average Sales Price | $1,591,892 (+2%) | $1,542,830 (+10%) |
Total Sales Volume | $90,737,844 (+45%) | $10,799,809 (-45%) |
Highest Sale | $3,990,000 | $2,805,000 |
LUXURY MARKET | MAIN CITIES
Market | New Listings | For Sale | Closed | Months Supply | Avg Price | Total Volume | Highest Sale |
|---|---|---|---|---|---|---|---|
Fort Collins | 34 (+13%) | 74 (-10%) | 27 (+50%) | 4.3 (-10%) | $1,734,409 (+13%) | $46,829,044 (+70%) | $3,990,000 |
Berthoud | 12 (+9%) | 55 (+6%) | 4 (+300%) | 14.1 (+22%) | $1,389,750 | $5,559,000 | $1,849,000 |
Estes Park | 5 (-38%) | 43 (-7%) | 6 (+20%) | 7.4 (-46%) | $1,440,417 (-6%) | $8,642,500 (+13%) | $1,625,000 |
Loveland | 21 (0%) | 59 (-9%) | 9 (-10%) | 7.7 (-33%) | $1,454,144 (-3%) | $13,087,300 (-12%) | $2,300,000 |
Timnath | 4 (-20%) | 15 (+7%) | 5 (+400%) | 3.8 (+36%) | $1,828,000 | $9,140,000 | $2,150,000 |
Windsor | 12 (-8%) | 31 (-24%) | 8 (+60%) | 4.7 (-23%) | $1,487,476 (+2%) | $11,899,809 (+64%) | $2,805,000 |
Boulder | 11 (+120%) | 61 (-10%) | 6 (+100%) | 16.6 (-10%) | $6,738,333 | $40,430,000 | $8,500,000 |
Longmont | 15 (-32%) | 75 (+6%) | 6 (-25%) | 7.6 (+4%) | $1,672,500 (-3%) | $10,035,000 (-27%) | $3,500,000 |
Denver Metro | 81 (+5%) | 322 (-5%) | 69 (+92%) | 6.0 (-20%) | $3,495,548 (-2%) | $233,014,932 (+90%) | $7,112,500 |
Evergreen | 10 (+43%) | 33 (-3%) | 1 (-67%) | 7.9 (-32%) | $3,070,000 | $3,070,000 | $3,070,000 |
Thresholds: $1,150,000 for Northern Colorado cities and Longmont; $2,400,000 for Denver Metro and Evergreen; $4,000,000 for Boulder. City of Boulder figures shown; Boulder Valley, covering Boulder County, recorded seven closings at the $4,000,000 threshold.
THE UPPER END PULLED AWAY
A caution about those numbers before we make anything of them.
Luxury data at the city level is small-sample data. Evergreen recorded one closing this July against three last year. Berthoud recorded four against one. Timnath, five against one. When a market transacts in single digits, one unusual house swings the average price by tens of percentage points while telling you nothing about conditions. Berthoud's 63 percent decline in average luxury price is measured against a July 2025 whose only luxury sale was a $3.8 million property. That is arithmetic in the costume of a trend.
Fort Collins, Larimer County, and Denver Metro have the volume to support real inference this month. Read the rest as directional at best.
The signal in those three is unmistakable.
Northern Colorado's luxury tier expanded against a flat broader market. Sixty-four closings, up 19 percent, produced $101.5 million in volume, up 23 percent, at an average price of $1,567,361, up 5 percent. New listings held essentially flat at 119 while standing inventory fell 2 percent. More product moved, at higher prices, out of a slightly smaller pool.
Larimer County produced nearly all of it, taking 57 of the region's 64 closings and $90.7 million of the $101.5 million. Larimer's luxury closings rose 43 percent while inventory fell 9 percent, compressing months of supply from 7.7 to 6.6. Weld went the other way on every measure that counts, with closings down 50 percent to seven, inventory up 16 percent, and months of supply climbing from 7.4 to 9.0. Seven closings is too thin to conclude much from, though the inventory build is a real number and bears watching.
Fort Collins was the engine. Twenty-seven closings, up 50 percent, generating $46.8 million, up 70 percent, at an average of $1,734,409, up 13 percent. It managed all of that while luxury inventory fell 10 percent, pulling months of supply down to 4.3, the tightest luxury absorption anywhere in this report except Timnath's five-transaction sample. Fort Collins alone accounted for roughly 47 percent of Larimer's luxury closings and 52 percent of its volume, and its top sale of $3,990,000 was the highest in Northern Colorado.
None of which should surprise anyone following the national research. With 63 percent of luxury specialists reporting more all-cash activity, the buyers driving this tier barely register a move in the ten-year. Fort Collins luxury absorption tightened during the very month the Treasury broke 4.7 percent.
One observation deserves more attention than it usually gets. The national convention defines luxury as the top 5 percent of transactions. In July, sales above $1.15 million made up 6.1 percent of all Northern Colorado closings and 10.1 percent of all Fort Collins closings. Fort Collins is transacting above its own luxury threshold at roughly twice the rate the definition implies, which suggests the $1.15 million line now sits below where a true top-5-percent cut would fall in that submarket. Anyone selling between roughly $1.1 and $1.4 million should take this practically: that band may be functioning as an upper-conventional market with real competition rather than a scarce luxury tier, and pricing and marketing might sensibly reflect it.
Denver Metro produced the month's largest headline, with 69 closings against 36, volume up 90 percent to $233 million, and months of supply compressing from 7.5 to 6.0. It comes with an asterisk. The Denver Metro Association of Realtors called July the metro's strongest luxury market since 2022, with luxury condominium sales up roughly 81 percent year over year. A meaningful share of that traces to newly delivered branded-residence product, the Waldorf Astoria Cherry Creek among it, which simply did not exist as inventory a year ago. New supply converting to closings is real demand, though it operates differently from resale acceleration, and the full 92 percent should not be read as organic. Against a broader metro market where sales fell roughly 12 percent year over year and the median price slipped 1.54 percent for the month, it is bifurcation in its purest form.
Boulder Valley above $4 million stays structurally illiquid: seven closings, 92 homes for sale, 23.5 months of supply against 18.1 a year ago. Nearly two years of standing inventory at the current pace. The 194 percent volume gain and 26 percent price gain rest on seven transactions and should be read that way. What matters to a seller at that level is that the market may absorb a handful of properties a month, and that governs pricing discipline, marketing horizon, and carrying-cost planning far more than any year-over-year figure.
Denver Foothills was the only luxury market to fall across the board, with closings down 20 percent, volume down 27, and average price down 8. It matches Evergreen's weakness in the broader data and the repricing of insurance and wildfire risk throughout Colorado's mountain markets.
WHAT THIS MONTH MEANS, BY SITUATION
Real estate is local to the property, and no two homes are alike. What follows extends the guidance in this month's summary, and every point deserves testing against the specific asset, timeline, and objective involved.
FOR LUXURY BUYERS AND SELLERS
The tier is active, though liquidity varies enormously by geography: 4.3 months of supply in Fort Collins against 9.0 in Weld County and 23.5 in Boulder Valley above $4 million. Pricing strategy at this level depends far more on how many comparable properties actually transact in a given submarket in a given quarter than on any regional average. At Boulder Valley's current pace, a seller may be one of a very small number of transactions in an entire season, which shapes marketing horizon and carrying-cost planning more than any percentage change.
Cash continues to confer real advantage. With 63 percent of luxury specialists nationally reporting increased all-cash activity, a financed offer may face structural competition that did not exist several years ago. Sellers should ask about the composition of their buyer pool, not only its size.
The Fort Collins threshold observation matters most in the $1.1 to $1.4 million band. If that price point is functioning as an upper-conventional market rather than a scarce luxury tier, then positioning, photography, and pricing precision carry more weight than they would in a genuinely thin segment.
FOR LEGACY HOLDERS
If you have held a property for decades, the number that changed most this year is not the sale price. It is the tax bill. Colorado's expiring relief and phasing-in assessment rates have produced increases of 20 to 40 percent for many owners, in some cases on properties whose assessed value held flat. For a long-held home with a low basis and no mortgage, property tax may now be the single largest annual cost of ownership, and it is worth recalculating rather than assuming.
The rolling 12-month averages in this report are least useful for legacy property. A ranch, a historic home, or an estate parcel has few genuine comparables, and a regional average built largely from tract housing says little about what it would bring. Valuation for these properties is an individual exercise.
Decisions about generational transfer, cost basis, and timing sit with your CPA and estate attorney, and we would encourage looping them in before rather than after a listing conversation. What we can say from the market data is that a flat-price year is a poor year to make a hold-or-sell decision on price alone. The determining variables are usually family timing, carrying cost, and the property's condition relative to what it would take to bring it to market.
One practical item: owners aged 65 and older who have occupied a property for ten years or more may qualify for the Senior Property Tax Homestead Exemption, exempting half the value of the first $200,000.
FOR INVESTORS
The attached segment presents a genuine dislocation, and it deserves careful arithmetic rather than enthusiasm. Prices are down across nearly every market we track. Rents are not rising to meet them. Fort Collins apartment rents averaged roughly $2,003 in mid-2026, down about 1.5 percent year over year, while Greeley averaged roughly $1,509, up a fraction of a percent. Meanwhile dues, insurance, and property taxes are all climbing.
An asset with falling prices, flat rents, and rising carrying costs can still be a sound purchase, but only where the discount exceeds the present value of those cost increases. Where it does not, the lower price is explained rather than mispriced. Underwrite the association with the same rigor as the unit: reserve study, assessment history, master insurance, owner-occupancy ratio, and any litigation. Establish financeability under the 2026 agency condominium rules early, since it governs both your entry and your eventual exit.
Fort Collins continues to support the region's strongest rents, driven by higher local incomes, the university, and a concentration of professional employment. Loveland and Greeley serve different tenant profiles at different price points. Cap rate expectations should follow those distinctions rather than a regional average.
FOR THOSE RELOCATING
The intra-regional spread is the most useful thing in this month's data, and it is invisible from outside the region. Loveland absorbs at 3.3 months and carries the lowest average single-family price in Northern Colorado at $627,248. Fort Collins absorbs at 3.4 months at $739,325 with the strongest appreciation. Windsor sits at 4.0 months and $724,970. Timnath runs at 4.3 months and $880,777, with new construction dominating. Berthoud has moved to 6.4 months at $784,444, and Estes Park to 7.4 months at $905,284.
Households with flexibility have materially different conditions available within a twenty-minute drive. A buyer with a $750,000 budget faces real competition in Fort Collins, more room to negotiate in Berthoud, and a different property type altogether in Timnath.
Two additional considerations for anyone arriving from out of state. Colorado property taxes are rising on a schedule independent of your purchase, so build the increase into your first two years rather than budgeting from the current bill. And if you are looking at foothills or mountain property, obtain insurance quotes at the beginning of diligence. Availability and pricing there have changed enough to affect which properties are practical.
ABOUT THIS DATA
Figures reflect July 2026 activity compared against July 2025. Average sales prices for all-price-point data represent rolling 12-month averages and will lag current conditions. Luxury thresholds follow the national convention of the top 5 percent of transactions and are set at $1,150,000 for Northern Colorado markets and Longmont, $2,400,000 for Denver Metro, Denver Foothills, and Evergreen, and $4,000,000 for Boulder and Boulder Valley. Northern Colorado comprises Larimer and Weld counties. Luxury figures at the individual-city level frequently rest on single-digit transaction counts, and percentage changes in those markets should be interpreted with corresponding caution.
National context draws on HousingWire, National Mortgage News, the Federal Reserve, Freddie Mac's Primary Mortgage Market Survey, the National Association of Realtors, and the Coldwell Banker Global Luxury mid-year report. Denver Metro figures reflect the Denver Metro Association of Realtors' July 2026 Market Trends Report. Property tax figures reflect the Colorado Department of Local Affairs and reporting from Colorado Public Radio and Colorado Politics. Rental figures are drawn from RentCafe and Yardi Matrix.
Nothing in this report constitutes tax, legal, or investment advice. Property tax treatment, exemptions, and estate considerations vary by circumstance and should be reviewed with a qualified professional. Market conditions change continually and no two properties are alike. Nothing here should be read as a guarantee of future performance or as advice specific to any individual property or transaction. We encourage clients to discuss your particular circumstances with us directly.
Stay up to date on the latest real estate trends.
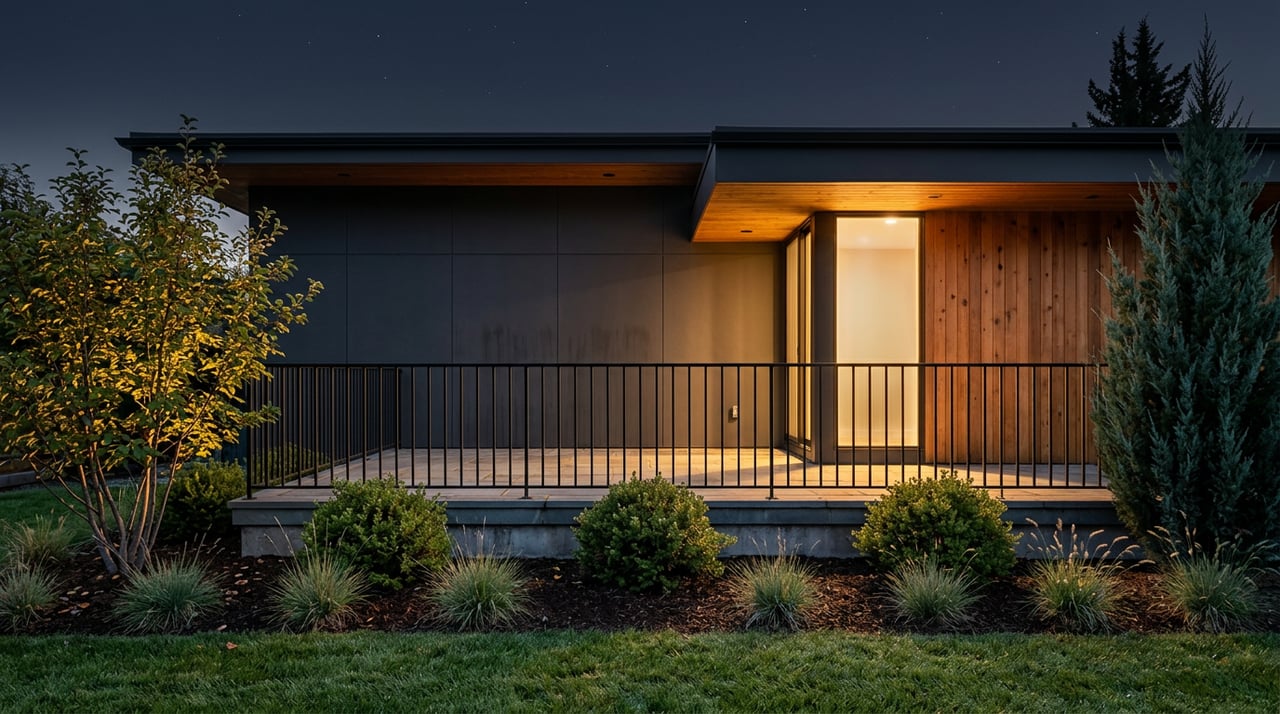
Market Update
Northern Colorado sales rose 3% in July while prices held flat and carrying costs climbed. Full data across nine markets, plus what it means by client situation.

Northern Colorado
Northern Colorado & Denver Metro Area Market Report
We enjoy being able to provide the level of expert detail and understanding to our clients that we would expect as a client if we were working through the same process. Whether it be going through the home buying process or listing your home, we look forward to working with you soon!
Ready to start a conversation?
Fort Collins 242 Linden St, Suite 216, Fort Collins, CO 80524 Boulder 1470 Walnut St, Suite 201/202, Boulder, CO 80302 Denver 200 Columbine St, Suite 400, Denver, CO 80206